| | Central Peace Sub-watershed
| Demographics
|
% of MP
|
|
Area
|
35,374 m2
|
17 %
|
|
Population
|
14,762
|
9%
|
|
|
|
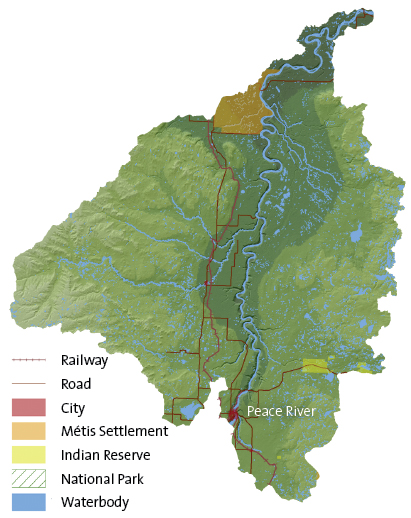
| Where People Live
|
|
|
City
|
|
|
|
Towns
|
8,270
|
57%
|
|
Rural
|
5,362
|
37%
|
|
Metis Settlement
|
|
|
|
Reserve
|
849
|
6%
|
| Surface Water Allocation (m3)
|
Groundwater Allocation (m3)
|
|
Total Volume
|
56,951,051 |
|
|
Total Volume
|
1,479,329 |
|
|
Agricultural
|
497,477
|
0.87%
|
|
Agricultural
|
113,259
|
7.66%
|
|
Industrial
|
3,331,850
|
5.85%
|
|
Industrial
|
298,135
|
20.15%
|
|
Municipal
|
7,816,418
|
13.72%
|
|
Municipal
|
887,323
|
59.98%
|
|
Commercial
|
39,089,299
|
68.64%
|
|
Commercial
|
52,200
|
3.53%
|
|
Watershed Management
|
2,536,410
|
4.45%
|
|
Other
|
0
|
0.00%
|
|
Habitat Enhancement
|
506,352
|
0.89%
|
|
Recreation
|
2,470
|
0.17%
|
|
Registration
|
474,662
|
0.83%
|
|
Registration
|
123,482
|
8.35%
|
|
Recreation
|
0
|
0.00%
|
|
Habitat Enhancement
|
|
|
|
Other
|
27,226
|
0.05%
|
|
|
|
|
|
Water Act Tests
|
52,826
|
0.09%
|
|
|
|
|
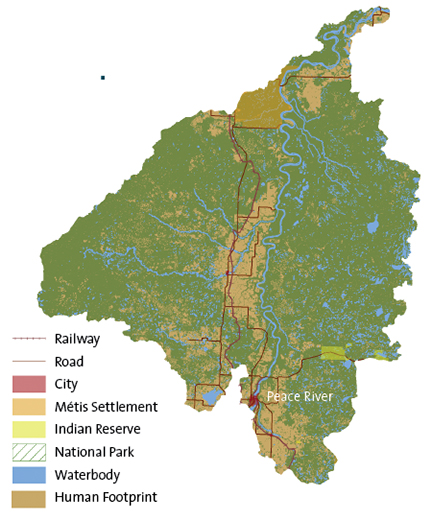
Footprint
|
Total Footprint |
16.92%
|
|
Cultivation (Crop/Pasture/Bare Ground)
|
9.49%
|
|
Cut Blocks
|
5.22%
|
|
Seismic line
|
0.99%
|
|
Road – Vegetated Verge
|
0.29%
|
|
Pipeline
|
0.18%
|
|
Rural (Residential/Industrial)
|
0.19%
|
|
Well Site
|
0.15%
|
|
Road – Hard Surface
|
0.16%
|
|
Road/Trail (Vegetated)
|
0.09%
|
|
Transmission Line
|
0.06%
|
|
Urban
|
0.01%
|
|
Borrow-Pits/Dugouts/Sumps
|
0.03%
|
|
Mine Site
|
0.01%
|
|
Industrial Site Rural
|
0.02%
|
|
Other Disturbed Vegetation
|
0.00%
|
|
Rail – Vegetated Verge
|
0.01%
|
|
Rail – Hard Surface
|
0.01%
|
|
Undisturbed |
83.08%
|
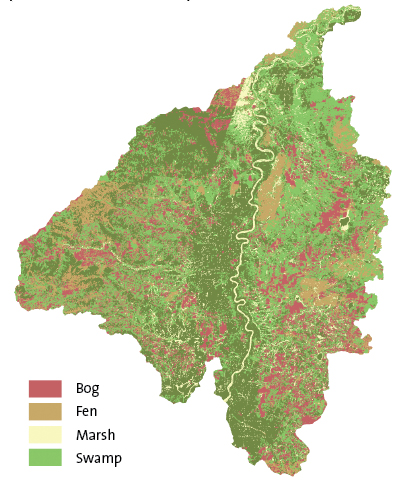
Wetland Cover (outside of national parks)
|
24%
|
8,393 km2
|
|
Wetland type within sub-watershed
|
|
Bog
|
28%
|
2,376 km2
|
|
Fen
|
20%
|
1,704 km2 |
|
Marsh
|
7%
|
597 km2 |
|
Swamp
|
44%
|
3,716 km2 |
| |
|
|