Surface Water QualitySurface water is all the water in rivers, streams and lakes. Groundwater is all of the water below the surface of the Earth. In the Mighty Peace watershed, the source and the quantity of flow are the biggest factors influencing surface water quality. When flow volumes change, as they typically do with the seasons, water quality also tends to change. High energy and large volumes of water have a greater capacity to move soil particles that have nutrients, metals and chemicals bound to them. By contrast, low-flow conditions often accentuate point sources of pollution due to a reduced dilution capacity. This is particularly evident in the Wapiti River as it flows past Grande Prairie.Alberta River Water Quality IndexThe Alberta River Water Quality Index (ARWQI) combines measurements taken regularly throughout the year of metals, nutrients, bacteria and pesticides. This allows for long-term comparisons of river water quality. Measurements used in the index all come from sites forming part of the Long-Term River Network (LTRN). There are 28 LTRN sites in Alberta, usually upstream and downstream of areas with significant human activity. Within the watershed, there are five LTRN sites.What the ARWQI Measures and Why
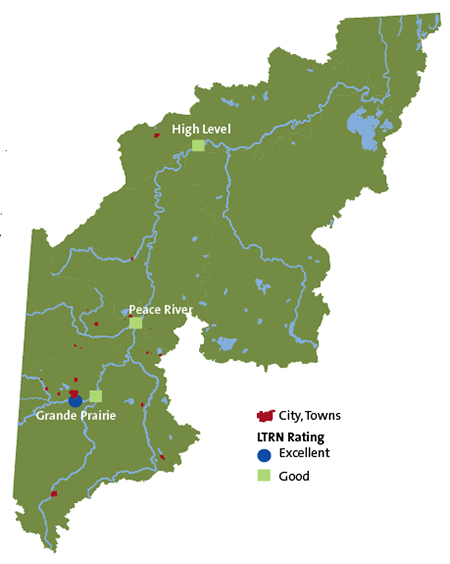
The map on the right shows the locations of LTRN monitoring sites in the watershed and their ratings averaged over the years from 1996 to 2010. All sites received scores of good to excellent. While the ARWQI results are favourable, this index does not represent conditions in smaller tributaries; it is a broad overview of the water quality in the major rivers. A change in the ARWQI occurs as the Wapiti River flows past the City of Grande Prairie and Weyerhaeuser's pulp mill. Treated effluent discharge has an impact on this decrease in ARWQI score, although non-point sources (for example, from Bear Creek) of pollution also play a role. Treated wastewater typically contains elevated levels of metals, bacteria and nutrients. Nutrients (in both municipal and mill discharges) and bacteria (municipal only) appear to cause the decrease in water quality. Elevated nutrient levels have resulted in higher production but lower biodiversity in aquatic invertebrates and increased aquatic plant production. All these effects occur to a certain degree downstream of treatment. The nutrient-enrichment effect continues in the Smoky River, particularly during periods of low flow. Although the combined treated effluent discharge from Aquatera (which collects wastewater from the City of Grande Prairie and its surroundings) and Weyerhaeuser have measurable effects, both facilities are highly regulated. They have adopted advanced treatment technologies and greatly improved treatment efficiencies over the years. The other pulp mill in the watershed, the Daishowa-Marubeni mill near the Town of Peace River, has made similar improvements. |
Alberta River Water Quality Scores
|
| 96-100 | Excellent | Guidelines almost always met; best quality |
| 81-95 | Good | Guidelines occasionally exceeded, but usually by small amounts; threat to quality is minimal |
| 66-80 | Fair | Guidelines sometimes exceeded by moderate amounts; quality occasionally departs from desirable levels |
| 46-65 | Marginal | Guidelines often exceeded, sometimes by large amounts; quality is threatened, often departing from desirable levels |
| © 2015 Mighty Peace Watershed Alliance | CONTACT THE ALLIANCE |
NEXT PAGE: Phosphorus on the Wapiti |