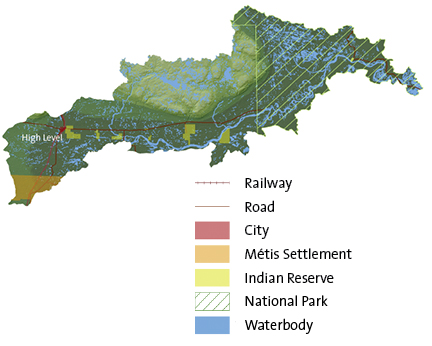
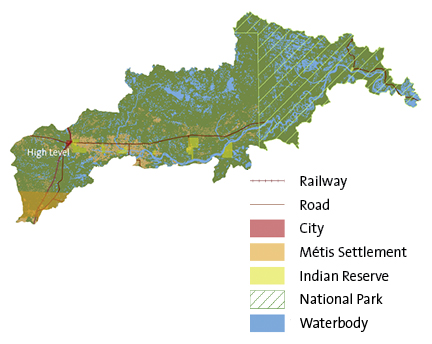
| | Lower Peace Sub-watershed
| Demographics
|
% of MP
|
|
Area
|
29,088 m2
|
14 %
|
|
Population
|
16,485
|
10%
|
|
|
|
|
Where People Live
|
|
|
City
|
|
|
|
Towns
|
3,641 |
22%
|
|
Rural
|
8,840
|
54%
|
|
Metis Settlement
|
|
|
|
Reserve
|
4,004
|
24%
|
| Surface Water Allocation (m3)
|
Groundwater Allocation (m3)
|
|
Total Volume
|
2,411,925 |
|
|
Total Volume
|
140,460 |
|
|
Agricultural
|
12,610 |
0.52%
|
|
Agricultural
|
3,600 |
2.63%
|
|
Industrial
|
0 |
0%
|
|
Industrial
|
0
|
0%
|
|
Municipal
|
1,458,839 |
60.48%
|
|
Municipal
|
8,630 |
6.14%
|
|
Commercial
|
474,674 |
19.68%
|
|
Commercial
|
0 |
0%
|
|
Watershed Management
|
426,780 |
17.69%
|
|
Other
|
128,100 |
91.20%
|
|
Habitat Enhancement
|
0 |
0%
|
|
Recreation
|
0 |
0%
|
|
Registration
|
37,757 |
1.57%
|
|
Registration
|
30 |
0.02%
|
|
Recreation
|
0 |
0%
|
| |
|
|
|
Other
|
1,265 |
0.05%
|
|
|
|
|
Footprint
|
Total Footprint |
6.20%
|
Cultivation
(Crop/Pasture/Bare Ground)
|
3.05%
|
| Cut Blocks
|
2.33%
|
| Seismic line
|
0.29%
|
| Road – Vegetated Verge
|
0.10%
|
| Pipeline
|
0.12%
|
| Rural (Residential/Industrial)
|
0.07%
|
| Well Site
|
0.06%
|
| Road – Hard Surface
|
0.06%
|
| Road/Trail (Vegetated)
|
0.04%
|
| Transmission Line
|
0.03%
|
| Urban
|
0.01%
|
| Borrow-Pits/Dugouts/Sumps
|
0.02%
|
| Mine Site
|
0.00%
|
| Industrial Site Rural
|
0.02%
|
| Other Disturbed Vegetation
|
0.00%
|
| Rail – Vegetated Verge
|
0.00%
|
| Rail – Hard Surface
|
0.00%
|
|
Undisturbed |
93.80%
|
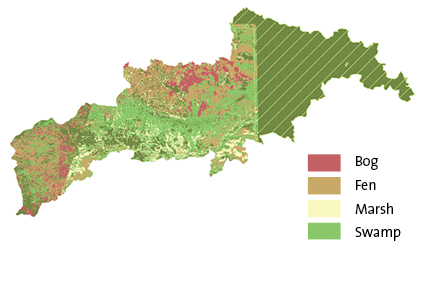
Wetland Cover (outside of national parks)
|
34%
|
6,660 km2
|
|
Wetland type within sub-watershed
|
|
Bog
|
22%
|
1,436 km2
|
|
Fen
|
36%
|
2,368 km2 |
|
Marsh
|
10%
|
676 km2 |
|
Swamp
|
33%
|
2,180 km2 |
| |
 |
|