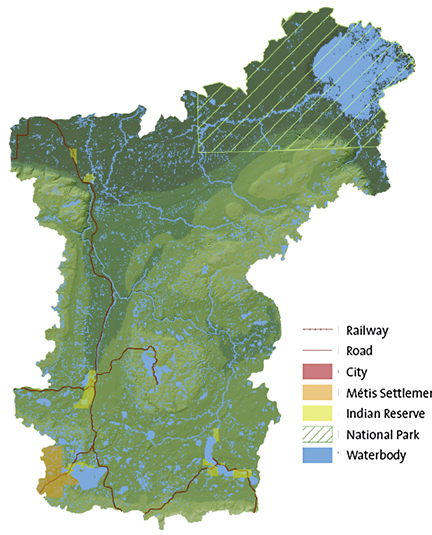
| | Wabasca Sub-watershed
| Demographics
|
% of MP
|
| Area
|
66,920 km2
|
32 %
|
| Population
|
13,944
|
8%
|
|
|
|
|
| Where People Live
|
|
| City
|
|
|
| Towns
|
|
|
| Rural
|
9,434
|
68%
|
| Metis Settlement
|
662
|
5%
|
| Reserve
|
3,848
|
28%
|
| Surface Water Allocation (m3)
|
Groundwater Allocation (m3)
|
|
Total Volume |
14,055,822
|
|
|
Total Volume
|
6,781,116 |
|
|
Agricultural
|
36,000
|
0.26%
|
|
Agricultural
|
1,803 |
0.03%
|
|
Industrial
|
470,910
|
3.35%
|
|
Industrial
|
5,975,521 |
88.12% |
|
Municipal
|
983,970
|
7.00%
|
|
Municipal
|
244,512 |
3.61%
|
|
Commercial
|
1,328,425
|
9.45%
|
|
Commercial
|
13,726 |
0.02%
|
|
Other
|
33,390
|
0.24%
|
|
Other
|
545,554
|
8.05%
|
Water Management:
Utikima Lake Enhancement Project
|
11,182,266
|
79.56%
|
|
|
|
|
Footprint
|
Total Footprint |
2.70%
|
| Cultivation (Crop/Pasture/Bare Ground)
|
1.33%
|
| Cut Blocks
|
1.01%
|
| Seismic line
|
0.12%
|
| Road – Vegetated Verge
|
0.04%
|
| Pipeline
|
0.05%
|
| Rural (Residential/Industrial)
|
0.03%
|
| Well Site
|
0.02%
|
| Road – Hard Surface
|
0.02%
|
| Road/Trail (Vegetated)
|
0.02%
|
| Transmission Line
|
0.01%
|
| Urban
|
0.01%
|
| Borrow-Pits/Dugouts/Sumps
|
0.01%
|
| Mine Site
|
0.00%
|
| Industrial Site Rural
|
0.01%
|
| Other Disturbed Vegetation
|
0.00%
|
| Rail – Vegetated Verge
|
0.00%
|
| Rail – Hard Surface
|
0.00%
|
|
Undisturbed |
97.30%
|
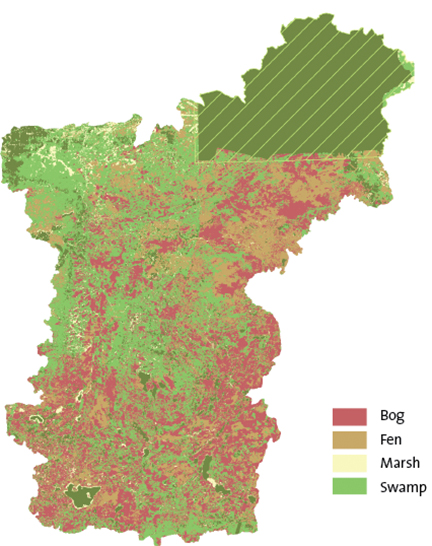
Wetland Cover (outside of national parks)
|
54%
|
29,565 km2
|
|
Wetland type within sub-watershed
|
|
Bog
|
33%
|
9,870 km2
|
|
Fen
|
30%
|
8,807 km2 |
|
Marsh
|
3%
|
952 km2 |
|
Swamp
|
34%
|
9,936 km2 |
| |
|
|