| | Slave Sub-watershed
| Demographics
|
% of MP
|
| Area
|
13,238 m2
|
6 %
|
| Population
|
100
|
~0 %
|
|
|
|
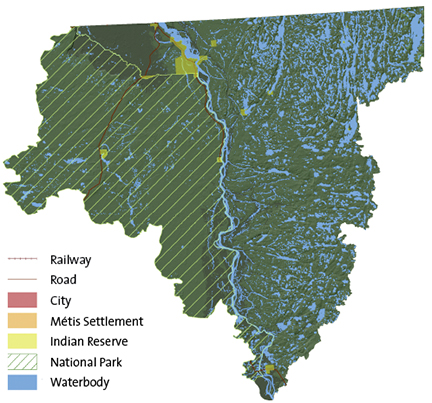
| Where People Live
|
|
| City
|
|
|
| Towns
|
|
|
| Rural
|
70
|
70%
|
| Metis Settlement
|
|
|
| Reserve
|
30
|
30%
|
Note: There are no water allocations in the Slave River Sub-Watershed.
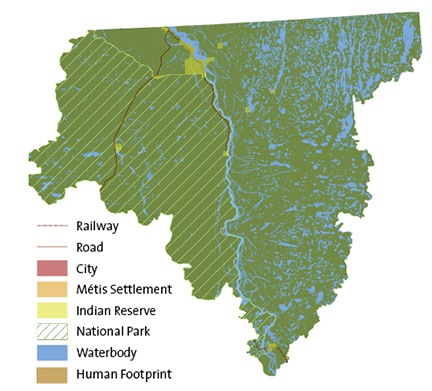
Footprint
|
Total Footprint |
0.10%
|
Cultivation
(Crop/Pasture/Bare Ground)
|
0.00%
|
|
Cut Blocks
|
0.00%
|
|
Seismic line
|
0.02%
|
|
Road – Vegetated Verge
|
0.02%
|
|
Pipeline
|
0.00%
|
|
Rural (Residential/Industrial)
|
0.01%
|
|
Well Site
|
0.00%
|
|
Road – Hard Surface
|
0.01%
|
|
Road/Trail (Vegetated)
|
0.03%
|
|
Transmission Line
|
0.00%
|
|
Urban
|
0.00%
|
|
Borrow-Pits/Dugouts/Sumps
|
0.00%
|
|
Mine Site
|
0.00%
|
|
Industrial Site Rural
|
0.00%
|
|
Other Disturbed Vegetation
|
0.00%
|
|
Rail – Vegetated Verge
|
0.00%
|
|
Rail – Hard Surface
|
0.00%
|
|
Undisturbed |
99.90%
|
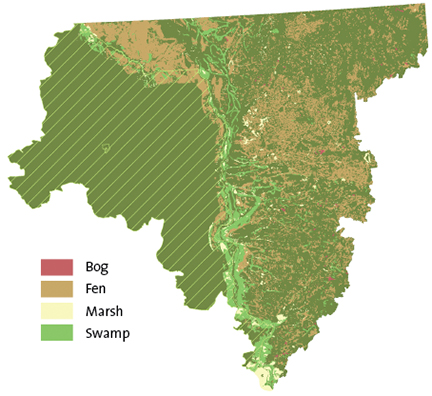
Wetland Cover (outside of national parks)
|
16%
|
1,247 km2
|
|
Wetland type within sub-watershed
|
|
Bog
|
1%
|
11 km2
|
|
Fen
|
66%
|
821 km2 |
|
Marsh
|
9%
|
118 km2 |
|
Swamp
|
24%
|
297 km2 |
| |
|