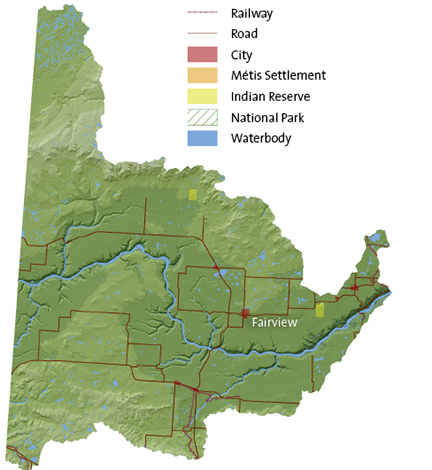
| | Upper Peace Sub-watershed
|
Demographics |
% of Mighty Peace
|
|
Area
|
17,554 m2
|
8 %
|
|
Population
|
18,010
|
11%
|
|
|
|
|
Where People Live
|
|
|
City
|
|
|
|
Towns
|
8,236
|
46%
|
|
Rural
|
9,610
|
53%
|
|
Metis Settlement
|
| 562
| 3%
|
Reserve
|
164
|
1%
|
| Surface Water Allocation (m3)
|
Groundwater Allocation (m3)
|
|
Total Volume
|
11,596,284 |
|
|
Total Volume
|
2,062,682
|
|
|
Agricultural
|
1,695,338
|
14.26%
|
|
Agricultural
|
66,494
|
3.22%
|
|
Industrial
|
310,840
|
2.61%
|
|
Industrial
|
382,150
|
18.53%
|
|
Municipal
|
3,324,112
|
27.95%
|
|
Municipal
|
1,402,643
|
68.00%
|
|
Commercial
|
1,379,515
|
11.60%
|
|
Commercial
|
98,407
|
4.77%
|
|
Watershed Management
|
2,466,147
|
21.27%
|
|
Other
|
96,10
|
0.47%
|
|
Habitat Enhancement
|
1,478,458
|
12.75%
|
|
Recreation
|
6,160
|
0.30%
|
|
Registration
|
887,479
|
7.46%
|
|
Registration
|
97,218
|
4.71%
|
|
Recreation
|
46,870
|
0.40%
|
|
Habitat Enhancement
|
|
|
|
Other
|
7,525
|
0.06%
|
|
|
|
|
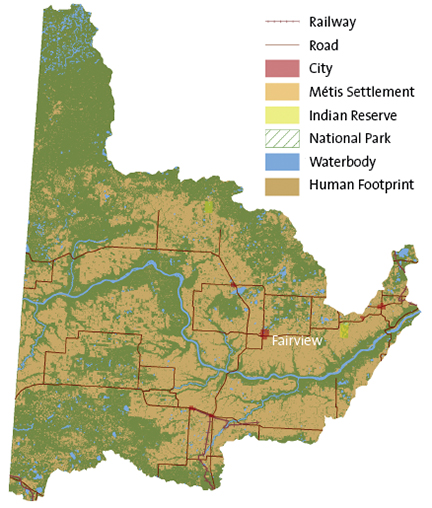
Footprint
|
Total Footprint |
45.32%
|
|
Cultivation (Crop/Pasture/Bare Ground)
|
36.61%
|
|
Cut Blocks
|
4.71%
|
|
Seismic line
|
0.78%
|
|
Road – Vegetated Verge
|
0.76%
|
|
Pipeline
|
0.36%
|
|
Rural (Residential/Industrial)
|
0.55%
|
|
Well Site
|
0.52%
|
|
Road – Hard Surface
|
0.44%
|
|
Road/Trail (Vegetated)
|
0.35%
|
|
Transmission Line
|
0.04%
|
|
Urban
|
0.03%
|
|
Borrow-Pits/Dugouts/Sumps
|
0.07%
|
|
Mine Site
|
0.03%
|
|
Industrial Site Rural
|
0.01%
|
|
Other Disturbed Vegetation
|
0.01%
|
|
Rail – Vegetated Verge
|
0.01%
|
|
Rail – Hard Surface
|
0.01%
|
| Undisturbed
|
54.68%
|
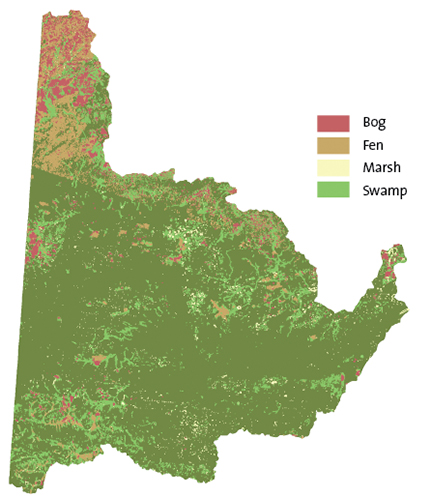
Wetland Cover (outside of national parks)
|
10%
|
1,836 km2
|
|
Wetland type within sub-watershed
|
|
Bog
|
23%
|
425 km2
|
|
Fen
|
29%
|
530 km2 |
|
Marsh
|
3%
|
55 km2 |
|
Swamp
|
45%
|
825 km2 |
| |
|
|